Report Generator
Automate report generation from your spreadsheet data
Performance reviews, sales reports, project summaries: upload your data and one example report. SheetRender produces a polished report for every row, on schedule.
Sound familiar?
- Building individual reports from raw data takes all day
- Reports need to look professional but you're not a designer
- Monthly report runs are tedious, repetitive work
How SheetRender helps
A better way to create reports
Start from a report you love
Upload an existing report: quarterly review, performance summary, client update. SheetRender studies it and builds a matching template for your spreadsheet data.
One report per row, instantly
Each row in your spreadsheet becomes its own report with the right name, numbers, and context. Generate the whole batch in minutes.
Schedule recurring runs
Set up a cadence and SheetRender generates each recurring report batch automatically, ready for review and delivery.
See it in action
Your data becomes personalized reports
| name | department | target | actual |
|---|---|---|---|
| Marcus Chen | Sales North | $65K | $71K |
| James Smith | Sales North | $70K | $62K |
| Priya Patel | Sales South | $60K | $68K |
| Dana Whitfield | Sales West | $75K | $74K |
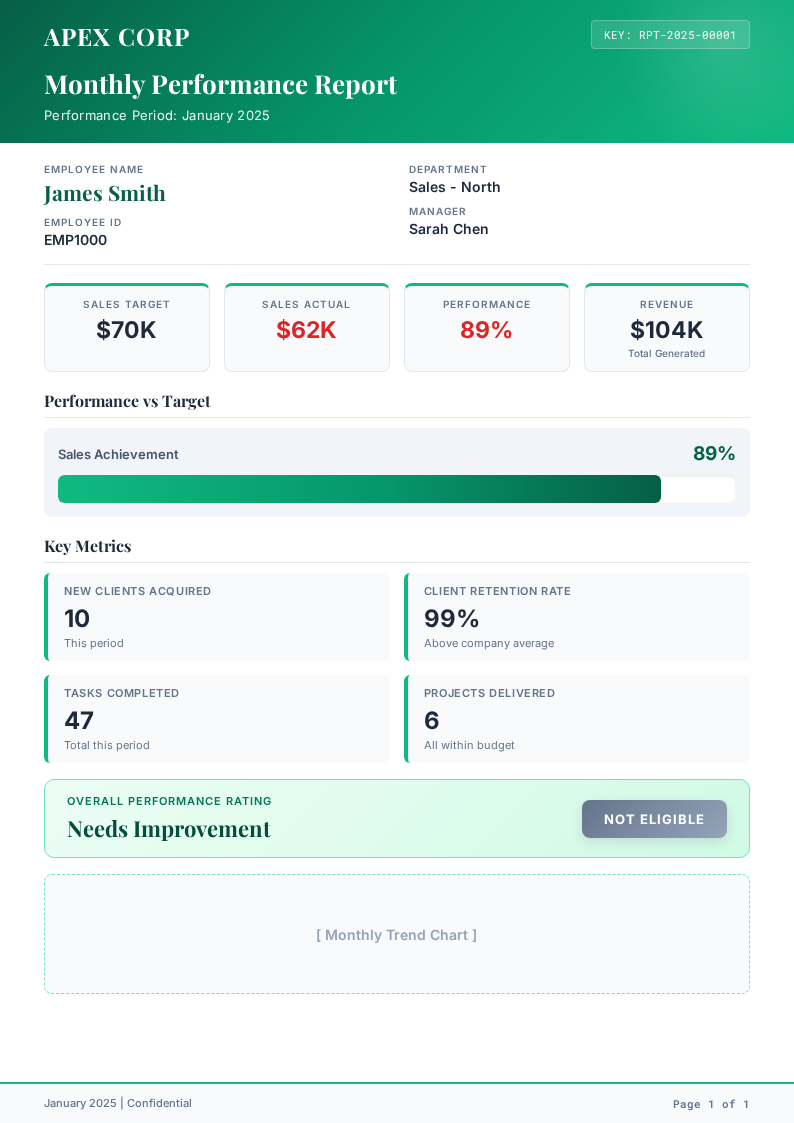
Each row becomes its own polished document, ready to download or email.
How to create reports from a spreadsheet
- 1
Point SheetRender at the data
Upload performance_q2.xlsx, or connect the Google Sheets™ spreadsheet the numbers already land in. Each row is one report: name, department, target, actual.
- 2
Upload the report you are copying
The report you sent last quarter is the best example you have. Its section order, headings, and typography are what the template inherits.
- 3
Let the template get built
Columns map onto the page: Marcus Chen at the top, $65K against $71K in the summary. Percentages and progress bars can be derived from those two columns instead of being typed in.
- 4
Refine what the numbers look like
Reorder sections, change the accent color, or describe the edit in words. Preview a row that missed target and one that beat it, because those are the two versions your readers get.
- 5
Generate one report per row
The batch renders as separate PDFs. Take them individually, zipped, or merged into a single file for a review meeting.
- 6
Schedule the recurring run
Monthly reporting is the case this exists for. Connect the sheet, set a monthly run, and the batch is waiting when the month closes. Starter includes one schedule; Pro removes the limit.
Frequently asked questions
- Can I automate monthly reports from Google Sheets™?
- Yes. Connect the spreadsheet, set a monthly run, and SheetRender re-reads the sheet before each one, so whatever the figures say that month is what gets rendered. Email delivery can be part of the same run.
- Does it draw charts?
- Simple visuals built from your numbers, like a progress bar sized by actual against target, are part of the template. Full charting is not: if a report needs a real plotted chart, put the image in your example document or expect a simpler page than your BI tool produces.
- One report per row, or one report for the whole sheet?
- One per row. A single roll-up that summarizes every row into one document is a different job, and SheetRender is not built for it. This is the tool for the batch, not for the one-page summary of the batch.
- Can different departments get different layouts?
- Yes, one layout at a time: run the batch once per layout, filtering rows on the department column each time. Each layout is its own template, and free covers two of them, so a third layout is a Starter question ($19 a month, 15 templates) and not a workflow question.
- What happens to reports after they are generated?
- They stay downloadable for as long as your plan keeps history: 30 days on free, 90 on Starter, a year on Pro, no expiry on Business. Regenerating from the same spreadsheet and template gives you the batch back either way.