Monthly report template
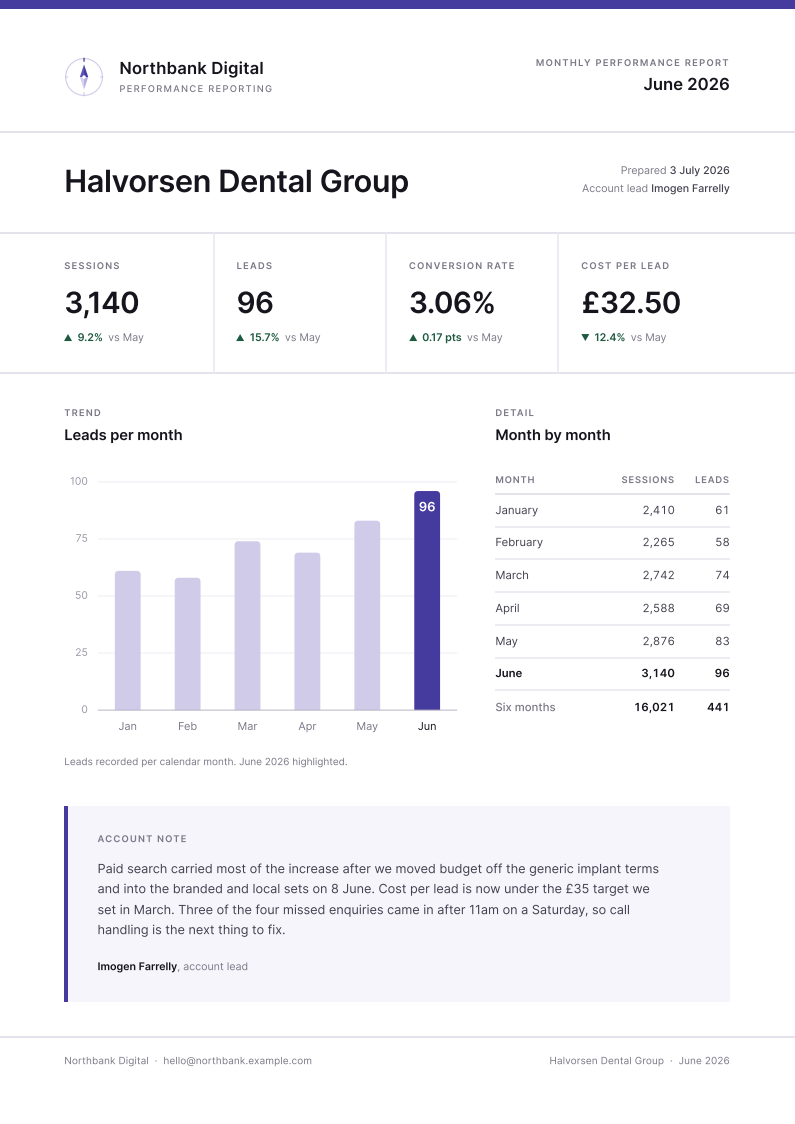
A one-page monthly report template for agency clients, with the metrics spreadsheet that fills it. Four headline numbers and one chart, then the note the client will read before anything else.
Free for personal and commercial use, no attribution required. The license, in one paragraph.
Who a monthly report template is for
Eighteen retainer clients, and the first three days of every month go into rebuilding the same deck eighteen times. The monthly report template here is deliberately one page: four numbers with their change on the month, one chart, and a note in your own words. If a client logs in and pokes at the data, send them a live dashboard instead and stop making PDFs for them. The PDF wins in the other case, which is most of them. They want one page in the inbox on the third of the month that they can forward to their own boss without explaining what a session is.
What is in the spreadsheet
The CSV and the Excel file hold the same 12 example rows. Every column below fills one part of the document.
| Column | Fills |
|---|---|
client_name | The client, printed as the report title. |
reporting_period | Month being reported, shown in the header and the footer. |
prepared_on | Date you sent it, top right of the title block. |
account_manager | Who owns the account. Signs the note at the bottom. |
sessions_jan | January sessions. First row of the table. |
sessions_feb | February sessions. |
sessions_mar | March sessions. |
sessions_apr | April sessions. |
sessions_may | May sessions, the comparison month for the tiles. |
sessions_jun | June sessions. Fills the Sessions tile. |
sessions_change | Signed change in sessions on the previous month, already formatted. |
leads_jan | January leads. First bar in the chart. |
leads_feb | February leads. |
leads_mar | March leads. |
leads_apr | April leads. |
leads_may | May leads. |
leads_jun | June leads. The highlighted bar and the Leads tile. |
leads_change | Signed change in leads on the previous month. |
conversion_rate | Leads as a percentage of sessions for the month. |
conversion_rate_change | Movement in that rate, in percentage points. |
cost_per_lead | Spend divided by leads, with the currency symbol. |
cost_per_lead_change | Signed change in cost per lead. Down is good, so the arrow flips. |
commentary | The account note. Two or three sentences in your own voice. |
What to change before you send it
Start at the header. The agency name is one line of text, the compass beside it is inline SVG so there is no image file to relink, and the indigo accent is a single variable at the top of the stylesheet. The month columns are named jan through jun because the chart covers a six month window; when that window rolls forward, rename them in the sheet and change the six axis labels in the example to match. If leads are not what you are paid on, this doubles as a sales report template: swap the chart to closed deals, put average order value in the fourth tile, relabel the y axis. Keep the bar heights proportional to the numbers you print. A client should be able to read the chart in two seconds and not be misled by it.
How to use it
- 1
Download example.html and open it in any browser to see the finished report. Download data.csv or data.xlsx for the matching metrics sheet, one row per client.
- 2
Replace Northbank Digital with your own name and swap the inline SVG compass for your mark. It is drawn in the HTML, so there is no image file to relink.
- 3
Fill one row per client for the month you are reporting. Pull sessions and leads from your analytics export. The change columns ship as plain text so the file reads the same everywhere, so put a formula behind them in your own copy rather than retyping the percentages every month.
- 4
For a handful of clients, edit the HTML by hand each month and print to PDF from the browser.
- 5
For more clients than you want to edit by hand, upload the sheet and the example to SheetRender and get one report per client from a spreadsheet in a single run.
One report per client from a spreadsheet
The download is yours either way. What takes the time is the other 11 rows. Upload this spreadsheet and this example document to SheetRender and it builds the template for you, then renders one correctly named PDF for every row. It is our product, so read this knowing that. The free plan covers 50 documents a month and puts a small "Made with SheetRender" line at the foot of every page, which a certificate someone frames will not survive. Rendering on a schedule is paid.
Frequently asked questions
- How do I make a monthly client report from a spreadsheet?
- Build the report once as a finished page, with one client's real numbers in it, then treat your spreadsheet as the source for every other client. One row per client, one column per value the page prints. From there you either edit the page by hand for each client, or hand both files to a tool that merges the row into the layout and writes a PDF per row. Spreadsheet reports go wrong when the design lives in the sheet and every client gets a slightly different copy of it. Keep the two apart and the monthly rebuild stops happening.
- Should I send a PDF report or give the client a live dashboard?
- Give them a dashboard when they log in and look at it. Looker Studio is free, connects to Google Analytics and Google Ads in a few clicks, and never needs a person to press send. The PDF wins in the other case, which is more common than agencies admit: the client wants one page in their inbox on the third of the month, with your commentary on it, that they can forward to a finance director who will never open a dashboard link. Some clients need both, and the report is the thing that gets read.
- Can I convert this to PDF from Excel or Google Sheets?
- You can print a sheet to PDF, but you get a grid, not a report. The csv to pdf step that produces something worth sending keeps the data and the design apart: the spreadsheet holds the numbers, an HTML page holds the layout, and the merge puts one row into one page. That is why this template ships as a pair. The spreadsheet is deliberately plain and the design lives entirely in the example file.
- How do I get one report per client without doing it eighteen times?
- Put every client on its own row, keep the column names identical, and generate the batch in one pass. SheetRender is our tool for that: you upload the sheet and the example document, map the columns once, and it writes one PDF per row. Free does 50 reports a month with a small "Made with SheetRender" line at the foot. On twelve clients that is one trial month with room to re-render, and it is not the plan you send from every month. Scheduled monthly runs are paid.
- What should go in the commentary?
- The thing you would say on a call. What moved, what you changed to move it, and what you are doing next. The numbers are already on the page, so a paragraph that restates them wastes the only part of the report a client reads properly. In the example, the note names the date the budget moved and the reason cost per lead fell, which is the difference between a report and a receipt.
- Does the chart update automatically when I change the numbers?
- Not in the raw HTML file. The bars are hand drawn SVG with coordinates worked out from the six monthly figures, so if you edit the file yourself you also adjust the bar heights. When the batch is generated from a spreadsheet, the tool redraws the chart per row from that row's numbers. Either way, check one rendered page against the sheet before sending the batch, because a chart that disagrees with the table beside it is the fastest way to lose a client's trust in the report.
More free templates
- Mail merge letterA mail merge letter template that is already a finished document: a renewal notice on a proper letterhead, with the contact spreadsheet behind it. Row one is filled in and eleven more rows are waiting.
- Course completion certificateA landscape A4 course completion certificate with a drawn guilloche border and a proper seal, set so the attendee name is the largest thing on the page. Beside it sits the attendee sheet that fills it in, one row per person.
- Job offer letterA job offer letter template that reads like something a real HR team sends. The key terms sit in their own panel, so the candidate lands on the salary and the start date before anything else, and the acceptance block at the foot gives them somewhere to sign. It comes with the candidate spreadsheet behind it.